
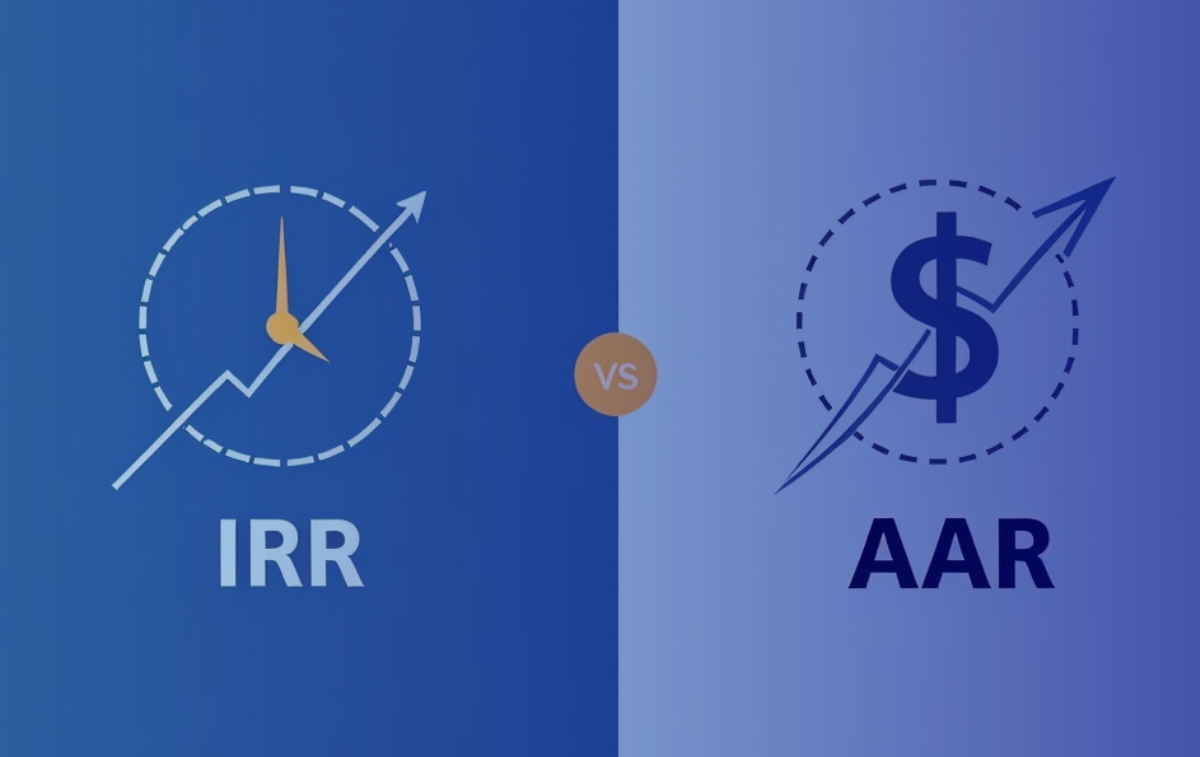
JACKSONVILLE, FL – We focus on the crucial aspects of deal presentation, particularly the comparison between Internal Rate of Return (IRR) and Average Annual Return (AAR). As AAR becomes increasingly popular in real estate investment discussions, it’s important to understand the differences between these two metrics and their implications for decision-making.
Before diving into specific scenarios, let’s clarify the distinction between IRR and AAR. IRR is a comprehensive measure that accounts for the overall performance of an investment, factoring in initial capital, the time required to recover the investment, and the total return, all while considering the time value of money. Essentially, the longer it takes to achieve a return, the lower the IRR.
Conversely, AAR calculates a straight-line average of the cash-on-cash returns throughout the investment’s life. Unlike IRR, AAR does not account for the time value of money, making it a simpler, though less precise, metric. AAR can be easily adjusted by changing the exit cap rate, which adds flexibility in projecting potential outcomes.
Scenario Analysis
To better understand how IRR and AAR perform under different conditions, we examined three distinct scenarios:
Scenario One: In this scenario, a property is purchased with fixed agency debt at 65% leverage and experiences 3% NOI growth annually. The average cash-on-cash return during the hold period ranges between 6.5% and 7%. This results in an AAR of 31.64%, a figure that appears strong. However, the IRR stands at 10.62%, which might not be appealing to institutional investors looking for higher risk-adjusted returns.
Scenario Two: This scenario presents a property facing operational challenges. The operator manages to maintain NOI despite these challenges, but the floating rate bridge debt significantly impacts net cash flows. In this case, the sponsor needs to inject additional capital in year four to cover negative cash flow. While the property still delivers a positive AAR, the IRR is less attractive, emphasizing the importance of understanding how debt structures impact returns.
Scenario Three: Here, we explore a “worst-case” scenario involving negative NOI growth, increasing debt service, and capital calls. Despite these issues, the property still shows a positive AAR. However, the IRR turns negative, highlighting that while AAR might look favorable, it doesn’t fully capture the risk and timing factors that IRR considers.
Key Takeaways
One key insight is the relationship between AAR and the investment hold period. If the AAR is lower than the number of years divided by 1 (for example, an investment held for 5 years would require a minimum AAR of 20% to break even), it indicates that a full return of capital might not be achieved. In our example, an exit cap rate of 5.75% would be needed to reach that 20% AAR.
Questions to Ask
When presented with an investment opportunity where AAR is highlighted, it’s essential to ask critical questions:
- What is the IRR, and how does it compare to the AAR?
- What exit cap rate assumptions are being made?
- How has the asset performed to date, and are these performance levels sustainable?
Conclusion
Understanding the differences between IRR and AAR is vital for making well-informed investment decisions. While AAR provides a straightforward view of potential returns, IRR offers a more nuanced perspective by accounting for the time value of money. By considering both metrics and asking the right questions, investors can better assess the risks and potential rewards of their investments.
For a more in-depth analysis and to explore the detailed data and methodology behind these findings, read the full article here.
About Nuvo Capital Partners
Nuvo Capital Partners is a niche market-focused multifamily private equity firm operating throughout the Southeastern United States. As a dedicated sponsor (General Partner), we specialize in institutional quality real estate investments within these regions. Our team, with a combined 25+ years of experience, has facilitated over $700M in transactions (10,000+ units). Delivering a transparent investment process, we provide our investors with access to high-quality real estate opportunities, while also ensuring integrity throughout. Our commitment extends to providing monthly, quarterly, and yearly in-depth reporting for our valued investors. To learn more, visit nuvocapitalpartners.com.
If you are interested in learning more about Nuvo Capital Partners and the investment opportunities we are currently exploring, please feel free to contact us here.
Leave A Comment